As 2016 rolls to a close, the Ukrainian economy is finding stronger footing. The pace of recovery remains slow, but it looks sustainable and the chances of a meaningful acceleration in 2017 are high. Inflation is still in the high single digits, but a hike in regulated utility tariffs should boost it to near the NBU’s 12% target by year-end. The FX market is nearly balanced and the NBU is taking advantage of slight surpluses to replenish reserves. Ukraine’s external accounts look reasonably strong but they still pose a risk to the economy; any external shock could trigger market jitters. Smooth relations with the IMF and other IFIs remain a key precondition for the recovery of investor and domestic consumer confidence.
5-year high in GDP growth supported by domestic demand
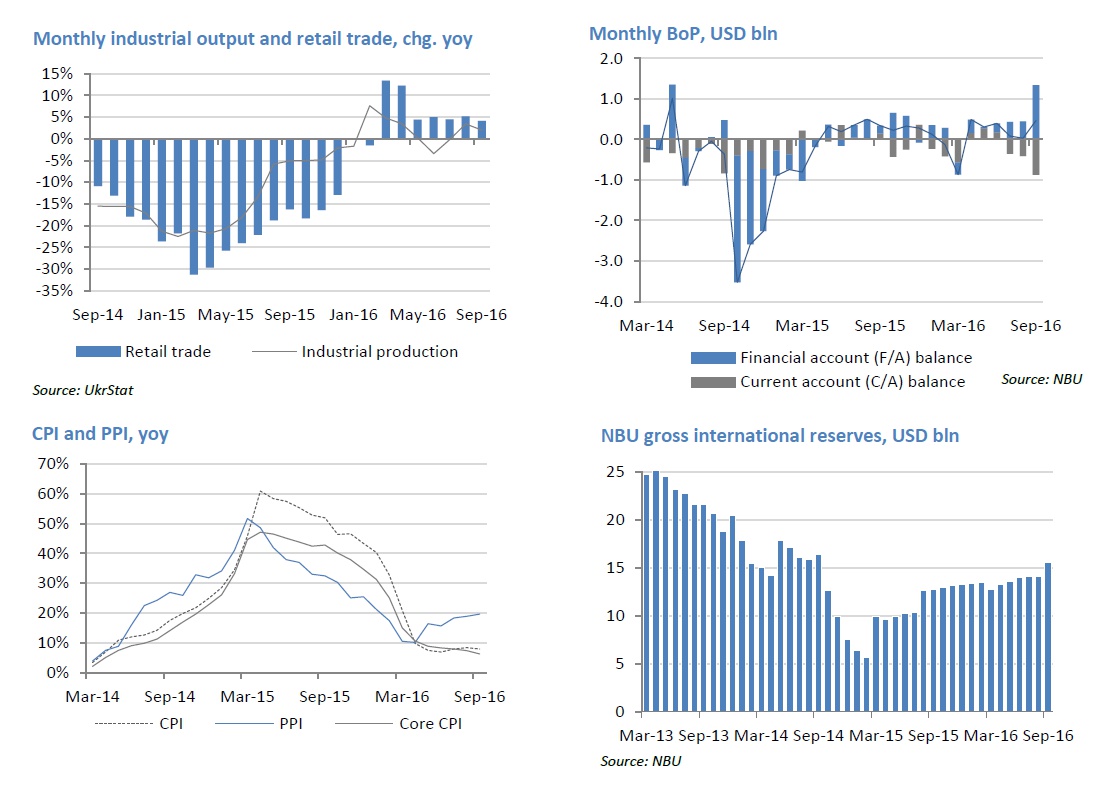
The economy is poised to deliver its fastest growth rate in the last 5 years: 1.4-1.6% yoy (our estimate). Domestic private demand has begun to recover and we see the pace accelerating in the coming quarters, helped by a stabilization of household incomes on the back of lower inflation. Household consumption jumped to +4.3% yoy in 2Q16 after 8 straight quarters in negative territory (yoy terms). Retail trade – a high frequency proxy for household demand – has been holding above 4% yoy since March. With purchasing power no longer dented by rapid inflation, households have re-gained a taste for consumption. Real salaries resumed growing in March and have accelerated notably since then, reaching 15.6% yoy in September. However, consumer confidence and propensity to consume still seem shaky as a cautious post-crisis mood prevails. Investment demand, another key GDP component, should also remain on the path to recovery as most sectors remain underinvested due to a near-complete freeze in new capex at the height of the crisis.

Utilities hike will allow NBU to meet 12% inflation target
Inflation slowed to 7.9% yoy in September (from 8.4% in August) thanks to food prices (+4.1% yoy). However, October will bring a material acceleration to above 11% as a heating tariff increase approved in the spring will hit consumer prices with the start of the heating season. This one marks the last material revision of regulated utility tariffs as part of the move to align domestic prices with energy import parity levels, a key requirement of Ukraine’s cooperation with the IMF. Energy imports will no longer need to be indirectly subsidized by the state – households will cover the cost of utilities or receive a direct budget subsidy. With the impact of the tariff hikes now uncovered and the long-term effects of the hryvnia depreciation visible, Ukraine’s consumer inflation in the future will be driven largely by fundamental factors more within the central bank’s control. This year’s CPI target of 12% +/-3% (taking into account one-off effects) will be met. This marks the successful launch the NBU’s inflation targeting policy approach, announced in 2015. With inflation coming in-line with its target, the NBU recently cut its key policy rate by 100 bps (50 bps more than the Bloomberg consensus forecast) to 14%.
Volatile external sector balances leave room for risks
Ukraine’s current accounts have remained balanced YTD – a reasonable C/A deficit (USD 2.3 bln in 9M16, 2.5% of 2016E GDP) was offset with financial account inflows, with the return of FX cash into the banking sector the single largest contributor. The FX market has been stable throughout October and the NBU purchased small FX surpluses through regular auctions. The receipt of an IMF loan tranche and a US guarantee (c. USD 1 bln each) have eliminated a key risk and brought confidence to the local market. The prospects for the near future are less certain – a fresh wave of delays with funding from IFIs could resurrect some uncertainty and trigger FX market volatility.
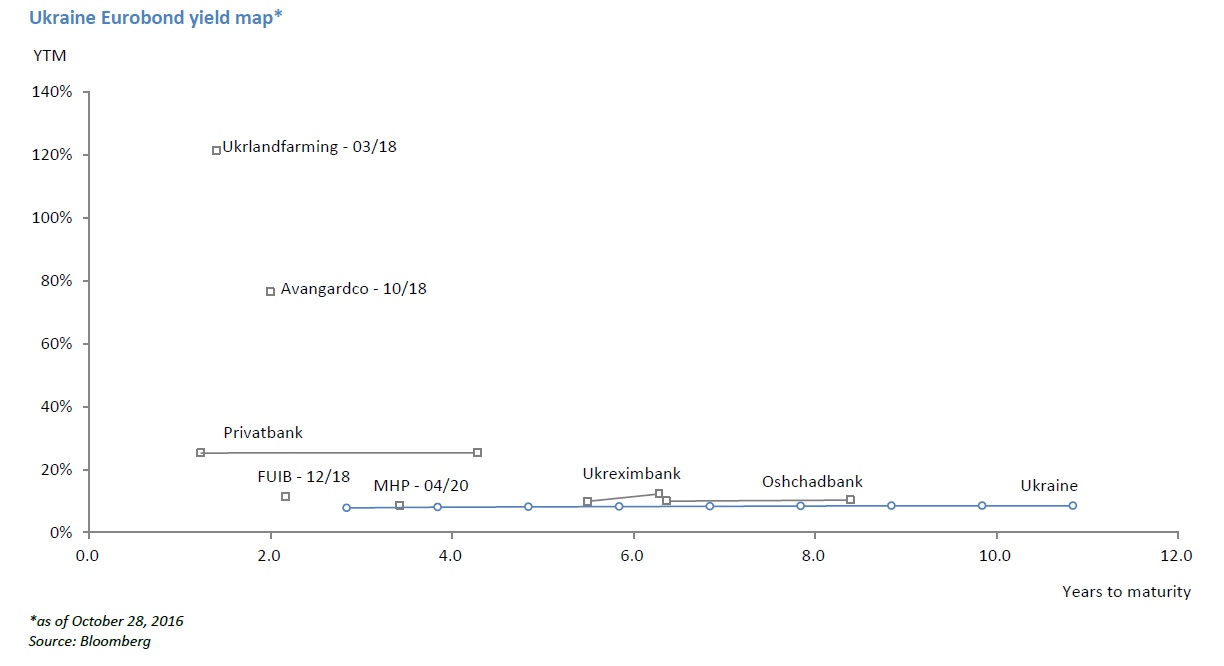
Ukraine Eurobond universe

Stock market summary

Key macro data and projections
| 2008 | 2009 | 2010 | 2011 | 2012 | 2013 | 2014 | 2015 | 2016E | |
| Business cycle indicators | |||||||||
| Real GDP, chg yoy | 2,3% | -14,8% | 4,1% | 5,2% | 0,2% | 0,2% | -6,8% | -9,9% | 1,5% |
| Household consumption, chg yoy | 11,8% | -14,9% | 7,1% | 15,7% | 11,7% | 7,7% | -9,6% | -20,2% | 4,5% |
| Investments in fixed capital, chg yoy | 1,6% | -50,5% | 3,9% | 7,1% | 0,9% | -6,7% | -23,0% | -9,3% | 6,0% |
| Industrial output, chg yoy | -5,2% | -21,9% | 11,2% | 8,0% | -0,7% | -4,3% | -10,1% | -13,0% | 2,0% |
| Nominal GDP, UAH bln | 948 | 913 | 1 079 | 1 300 | 1 405 | 1 465 | 1 567 | 1 979 | 2 351 |
| Nominal GDP, USD bln | 180 | 117 | 136 | 163 | 176 | 183 | 132 | 91 | 90 |
| GDP per capita, USD | 3 891 | 2 550 | 2 972 | 3 580 | 3 865 | 4 030 | 2 904 | 1 996 | 1 991 |
| CPI (eop) | 22,3% | 12,3% | 9,1% | 4,6% | -0,2% | 0,5% | 24,9% | 43,3% | 10,1% |
| CPI average | 25,2% | 15,9% | 9,4% | 8,0% | 0,6% | -0,3% | 12,1% | 48,7% | 13,9% |
| Unemployment (ILO methodology, avg) | 6,9% | 9,6% | 8,9% | 8,7% | 8,2% | 7,8% | 9,7% | 9,1% | 8,6% |
| Balance of payments | |||||||||
| Current account balance, USD bln | -12,8 | -1,7 | -3,0 | -10,2 | -14,3 | -16,5 | -5,3 | -0,2 | -2,8 |
| % GDP | -7,1% | -1,5% | -2,2% | -6,3% | -8,1% | -9,0% | -4,0% | -0,2% | -3,1% |
| Financial account balance, USD bln | 9,7 | -12,0 | 8,0 | 7,8 | 10,1 | 18,5 | -8,0 | 0,1 | 1,8 |
| % GDP | 5,4% | -10,2% | 5,9% | 4,8% | 5,8% | 10,1% | -6,1% | 0,1% | 2,0% |
| FDI net, USD bln | 9,9 | 4,7 | 5,8 | 7,0 | 6,6 | 3,4 | 0,3 | 2,5 | 2,5 |
| % of GDP | 5,5% | 4,0% | 4,2% | 4,3% | 3,8% | 1,8% | 0,2% | 2,8% | 2,8% |
| Gross NBU reserves (eop), USD bln | 31,5 | 26,5 | 34,6 | 31,8 | 24,5 | 20,4 | 7,5 | 13,3 | 17,8 |
| Monetary and banking indicators | |||||||||
| Monetary base, UAH bln | 187 | 195 | 226 | 240 | 255 | 307 | 333 | 336 | 346 |
| Monetary base, chg. yoy | 32% | 4% | 16% | 6% | 6% | 20% | 8% | 1% | 3% |
| Money supply (M3), UAH bln | 515 | 487 | 598 | 683 | 773 | 909 | 957 | 994 | 1 044 |
| Money supply, chg. yoy | 30% | -5% | 23% | 14% | 13% | 18% | 5% | 3% | 5% |
| Monetary multiplier (eop M3/MB) | 2,8 | 2,5 | 2,6 | 2,8 | 3,0 | 3,0 | 2,9 | 3,0 | 3,0 |
| Bank loans, chg. yoy | 72% | -2% | 1% | 10% | 2% | 12% | 13% | 3% | 4% |
| Bank deposits, chg. yoy | 28% | -8% | 26% | 18% | 16% | 18% | 0% | 4% | 17% |
| Loan-to-deposit ratio | 205% | 219% | 175% | 162% | 143% | 135% | 152% | 137% | 122% |
| Exchange rate | |||||||||
| Official UAH/USD (eop) | 7,70 | 7,99 | 7,96 | 7,99 | 7,99 | 7,99 | 15,77 | 24,00 | 26,00 |
| Official UAH/USD (avg) | 5,27 | 7,79 | 7,94 | 7,97 | 7,99 | 7,99 | 11,89 | 21,84 | 26,00 |
| Budget and debt indicators | |||||||||
| State budget revenues, UAH bln | 231,7 | 209,7 | 240,6 | 314,6 | 346,0 | 339,2 | 357,0 | 534,6 | 611,0 |
| % of GDP | 24,4% | 23,0% | 22,3% | 24,2% | 24,6% | 23,2% | 22,8% | 27,0% | 26,0% |
| State budget expenditures, UAH bln | 244,2 | 245,2 | 304,9 | 338,1 | 399,4 | 403,9 | 435,0 | 579,8 | 679,0 |
| % of GDP | 25,8% | 26,8% | 28,3% | 26,0% | 28,4% | 27,6% | 27,8% | 29,3% | 28,9% |
| State budget balance, UAH bln | -12,5 | -35,5 | -64,3 | -23,6 | -53,4 | -64,7 | -78,0 | -45,2 | -68,0 |
| % of GDP | -1,3% | -3,9% | -6,0% | -1,8% | -3,8% | -4,4% | -5,0% | -2,3% | -2,9% |
| Public debt, UAH bln | 189 | 318 | 432 | 473 | 516 | 584 | 1 101 | 1 572 | 1 939 |
| % GDP | 20,0% | 34,8% | 40,1% | 36,4% | 36,7% | 39,9% | 70,3% | 79,4% | 82,5% |
Check out >> Investment opportunities in Ukraine


