The pace of economic recovery thus far has not been particularly breathtaking as temporary negative factors, especially the suspension of trade in Eastern Ukraine, have prevented a full-fledged recovery after a hard crisis. Mid-term prospects look reasonably bright as the economy continues to show fundamental strength. Key macro indicators, including inflation and the BoP, are consistent with a slow but sustainable recovery. The next IMF review is the key event over the coming month. While not critical in the nearterm, securing the next loan tranche is important for the smooth servicing of the large sovereign debt redemptions coming in 2019.
Growth is volatile; domestic demand is supportive of an acceleration of growth
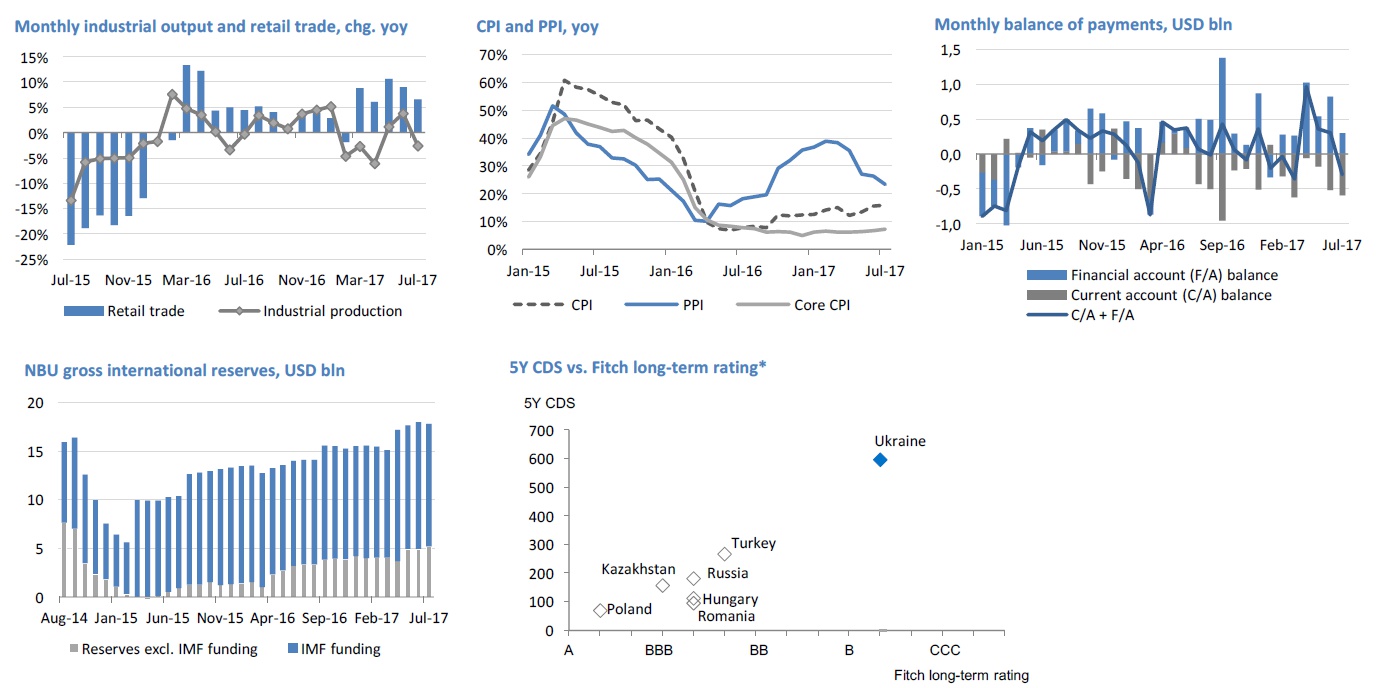
The Ukrainian economy continues to work through the consequences of the suspension of trade with the non-controlled territories in the east – GDP growth remains sluggish and volatile. As expected, industry has been the most vulnerable sector, with yoy growth swinging from negative to positive YTD. On a positive note, domestic-oriented sectors of the economy are showing persuasive signs that domestic demand is recovering rapidly and becoming the key driver of growth. In 7M17, retail trade grew 7.5% yoy, cargo transportation turnover increased 8.7%, and construction surged 24.2%. After a mixed 2017 hit by the effect of the trade blockade and a weaker trend in agriculture (we expect a slight output decline for full 2017), economic growth is well-placed to accelerate to 3.5-4.0% in 2018.
Inflation accelerates temporarily on agro price jitters
Consumer price growth has been accelerating since May and CPI increased 15.9% yoy as at end-July. Growth continues to be driven by multiple factors, all of which have been stronger than we had expected. Accelerating food prices have thus far been the key factor – poor weather had a material negative impact on the fruit and vegetable harvest. The wave of utility tariff revisions continues and the key inflation-related risk on the horizon is the need to revise gas tariffs for households in October (a requirement of the IMF program). The government remains reluctant to pull the trigger and is determined to negotiate a delay with the IMF. Overall, risks continue to build of end-2017 inflation exceeding our forecast of 10.1% and the NBU’s
target of 8% +/-2pp. Even though the key inflation drivers are temporary in nature, demand-side factors are gaining weight on a double-digit expansion of nominal household incomes. We now see diminishing prospects for the NBU to further cut its key policy rate (the last 50bp decrease to 12.5% took place in late May); any movement in the key rate is unlikely over the next three months.
C/A gap widens on strong imports, still no fundamental risks
The C/A deficit expanded moderately over the past month and the 12-month trailing tally stood at USD 4.6 bln, or 4.4% of 2017E GDP as of July. Commodity imports are growing robustly and outpacing export growth, supported by both consumer and investment consumption. Imports of energy materials, including gas, have been substantial YTD and should thus decrease over the rest of the year. We therefore see the C/A deficit approaching c. 4% of GDP for FY 2017. FDI, debt inflows, and the use of accumulated cash by households remain sufficient to fully cover the shortfall – a pattern we view as sustainable for the coming years. The FX market remains fairly balanced – the NBU’s sporadic interventions are inconsequential and haven’t altered the trend. Based on the stronger-thanforecast UAH performance YTD, we revise our average and end-2017 FX rate projection to UAH 26.5/USD and UAH 27.0/USD, respectively (from UAH 28.0/USD and UAH 28.5/USD).
IMF tranche by end-2017 looks realistic
As we highlighted in our previous report, the IMF is unlikely to take an overly strict stance towards program conditionality for Ukraine and may be comfortable with a “one step at a time” approach. The signals from the fund that land reform can be delayed with no effect on near-term cooperation comes as no surprise. We thus expect the IMF to focus entirely on pension
reform for the upcoming September review. Politically, the reform looks feasible given that both the government and the president have approved its concept.
| 2008 | 2009 | 2010 | 2011 | 2012 | 2013 | 2014 | 2015 | 2016 | 2017E | |
| Business cycle indicators | ||||||||||
| Real GDP, chg yoy | 2,3% | -14,8% | 4,1% | 5,2% | 0,2% | 0,2% | -6,8% | -10,2% | 1,5% | 2,4% |
| Household consumption, chg yoy | 11,8% | -14,9% | 7,1% | 15,7% | 11,7% | 7,7% | -9,6% | -21,0% | 3,2% | 3,5% |
| Investments in fixed capital, chg yoy | 1,6% | -50,5% | 3,9% | 7,1% | 0,9% | -6,7% | -23,0% | -31,0% | 14,5% | 12,0% |
| Industrial output, chg yoy | -5,2% | -21,9% | 11,2% | 8,0% | -0,7% | -4,3% | -10,1% | -13,5% | 2,4% | 3,0% |
| Nominal GDP, UAH bln | 948 | 913 | 1,079 | 1,3 | 1,405 | 1,465 | 1,567 | 1,928 | 2,351 | 2,744 |
| Nominal GDP, USD bln | 180 | 117 | 136 | 163 | 176 | 183 | 132 | 88 | 92 | 104 |
| GDP per capita, USD | 3,891 | 2,55 | 2,972 | 3,58 | 3,865 | 4,03 | 2,904 | 1,944 | 2,164 | 2,435 |
| CPI (eop) | 22,3% | 12,3% | 9,1% | 4,6% | -0,2% | 0,5% | 24,9% | 43,3% | 12,4% | 10,1% |
| CPI average | 25,2% | 15,9% | 9,4% | 8,0% | 0,6% | -0,3% | 12,1% | 43,3% | 13,9% | 12,1% |
| Unemployment (ILO methodology, avg) | 6,9% | 9,6% | 8,9% | 8,7% | 8,2% | 7,8% | 9,7% | 9,4% | 8,6% | 7,9% |
| Balance of payments | ||||||||||
| Current account balance, USD bln | -12,8 | -1,7 | -3 | -10,2 | -14,3 | -16,5 | -5,3 | -1 | -3,4 | -3,8 |
| % GDP | -7,1% | -1,5% | -2,2% | -6,3% | -8,1% | -9,0% | -4,0% | -1,1% | -3,7% | -3,7% |
| Financial account balance, USD bln | 9,7 | -12 | 8 | 7,8 | 10,1 | 18,5 | -8 | 0,8 | 4,5 | 3,3 |
| % GDP | 5,4% | -10,2% | 5,9% | 4,8% | 5,8% | 10,1% | -6,1% | 0,9% | 4,9% | 3,2% |
| FDI net, USD bln | 9,9 | 4,7 | 5,8 | 7 | 6,6 | 3,4 | 0,3 | 2,5 | 3,4 | 1,4 |
| % of GDP | 5,5% | 4,0% | 4,2% | 4,3% | 3,8% | 1,8% | 0,2% | 2,8% | 3,6% | 1,4% |
| Gross NBU reserves (eop), USD bln | 31,5 | 26,5 | 34,6 | 31,8 | 24,5 | 20,4 | 7,5 | 13,3 | 15,5 | 19,5 |
| Monetary and banking indicators | ||||||||||
| Monetary base, UAH bln | 187 | 195 | 226 | 240 | 255 | 307 | 333 | 347 | 382 | 393 |
| Monetary base, chg. yoy | 32% | 4% | 16% | 6% | 6% | 20% | 8% | 4% | 14% | 3% |
| Money supply (M3), UAH bln | 515 | 487 | 598 | 683 | 773 | 909 | 957 | 1,008 | 1,102 | 1,157 |
| Money supply, chg. yoy | 30% | -5% | 23% | 14% | 13% | 18% | 5% | 4% | 11% | 5% |
| Monetary multiplier (eop M3/MB) | 2,8 | 2,5 | 2,6 | 2,8 | 3 | 3 | 2,9 | 2,9 | 2,9 | 2,9 |
| Bank loans, chg. yoy | 72% | -2% | 1% | 10% | 2% | 12% | 13% | 3% | 2% | 8% |
| Bank deposits, chg. yoy | 28% | -8% | 26% | 18% | 16% | 18% | 0% | 4% | 10% | 15% |
| Loan-to-deposit ratio | 205% | 219% | 175% | 162% | 143% | 135% | 152% | 151% | 127% | 119% |
| Exchange rate | ||||||||||
| Official UAH/USD (eop) | 7,7 | 7,99 | 7,96 | 7,99 | 7,99 | 7,99 | 15,77 | 24 | 27,19 | 27 |
| Official UAH/USD (avg) | 5,27 | 7,79 | 7,94 | 7,97 | 7,99 | 7,99 | 11,89 | 21,84 | 25,55 | 26,5 |
| Budget and debt indicators | ||||||||||
| State budget revenues, UAH bln | 231,7 | 209,7 | 240,6 | 314,6 | 346 | 339,2 | 357 | 519 | 616,3 | 724 |
| % of GDP | 24,4% | 23,0% | 22,3% | 24,2% | 24,6% | 23,2% | 22,8% | 26,9% | 26,2% | 26,3% |
| State budget expenditures, UAH bln | 244,2 | 245,2 | 304,9 | 338,1 | 399,4 | 403,9 | 435 | 552 | 686,4 | 806 |
| % of GDP | 25,8% | 26,8% | 28,3% | 26,0% | 28,4% | 27,6% | 27,8% | 28,6% | 29,2% | 29,3% |
| State budget balance, UAH bln | -12,5 | -35,5 | -64,3 | -23,6 | -53,4 | -64,7 | -78 | -33 | -70,1 | -82 |
| % of GDP | -1,3% | -3,9% | -6,0% | -1,8% | -3,8% | -4,4% | -5,0% | -1,7% | -3,0% | -3,0% |
| Public debt, UAH bln | 189 | 318 | 432 | 473 | 516 | 584 | 1,101 | 1,572 | 1,93 | 2,175 |
| % GDP | 20,0% | 34,8% | 40,1% | 36,4% | 36,7% | 39,9% | 70,3% | 79,4% | 82,1% | 79,0% |


