Ukraine faces its final chance to regain the confidence of the IMF and restart lending under the current program. If Ukraine squanders this opportunity, it will have to muddle through to end-2019 without any material support from IFIs. Signs in recent days that parliament is preparing to vote on a version of the law on an anti-corruption court that would be acceptable to the IMF offers real hope for a favorable outcome. The return of Ukraine’s largest lender would help maintain economic stability, safeguard the FX market from major shocks, and bring Ukraine back to the investor spotlight following the March 2019 presidential elections.
Full-year economic growth to exceed 3% for the 1st time since 2011
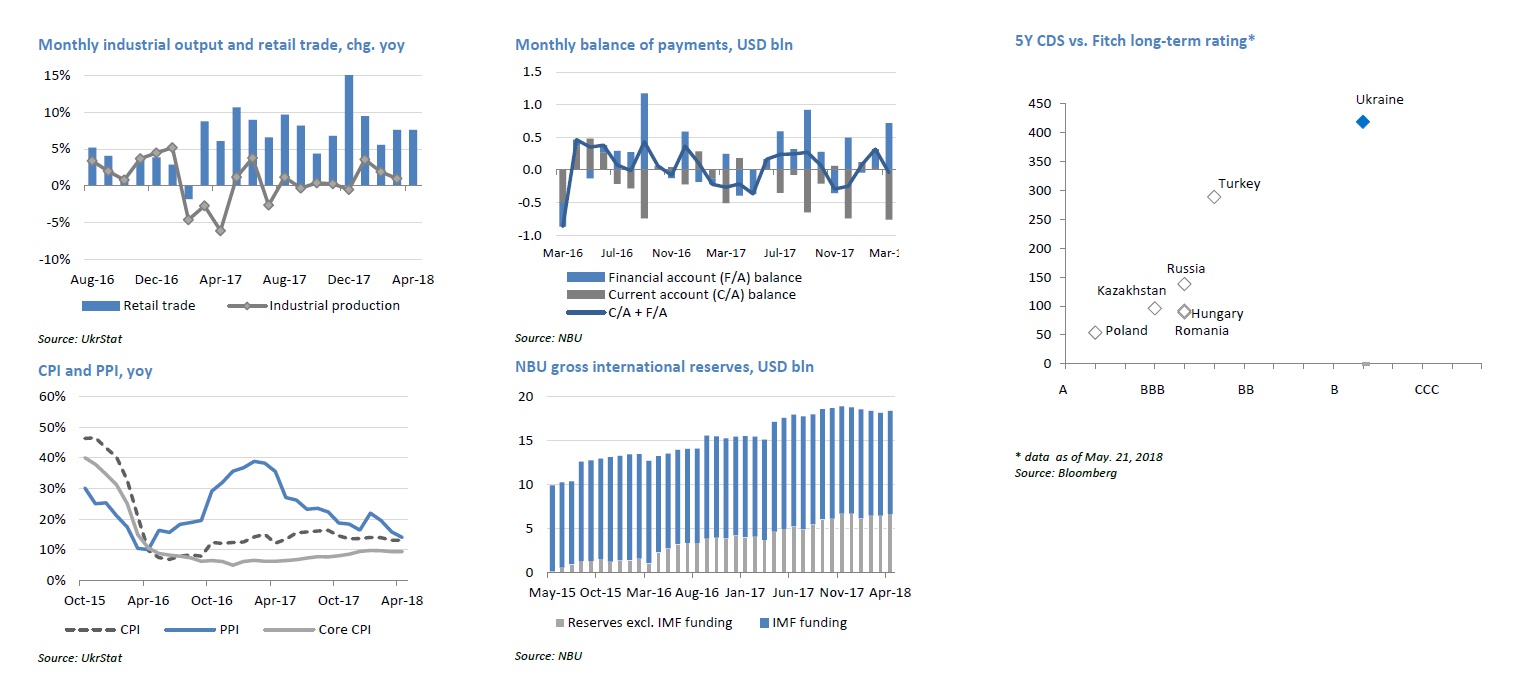
Economic growth surprised to the upside in the 1Q – GDP grew 3.1% yoy and 0.9% qoq, supported by strong domestic demand. Growth in retail trade remains above 7% on the back of continued increases in salaries. Growth in other key sectors, including industry, remains feeble, but it should pick up starting in the 2Q against a depressed base. Private consumption will remain the key growth driver, also supported by investments. However, the contribution of net exports will remain negative, as in previous years. We maintain our full-year 2018 GDP growth forecast at 3.1%. With risks currently to the upside, in our view, 2018 will be the first year since 2011 that Ukraine will deliver at least 3% annual growth.
CPI to remain on a downward trend and enter single digits in summer The pace of growth in consumer prices has been decelerating gradually since the start of 2018, but somewhat slower than we had anticipated with end-April CPI at 13.1%. Inflation will slow further in the coming months as last year’s food price shock (adverse weather conditions) established a high base. This year’s weather is much better, which bodes well for agricultural products and food prices; these goods account for over 40% of the consumer basket. The strength and relative stability of the hryvnia will also support a smooth deceleration of the CPI trend. Inflation is poised to slip below 10% in the summer, and we see no major risks to our current end-2018 CPI forecast of 8.9% as long as no new shocks materialize (like a pre-election hike in the minimum wage).
The NBU has clearly signaled that any loosening of monetary policy is highly unlikely through the end of 2018 and the current policy rate looks sufficient to bring inflation back to the target range by mid-2019. In-line with market consensus, we expect the central bank will hold its rate following this week’s monetary policy committee meeting. However, the NBU’s stance could change if major risks related to capital outflows or a loosening of fiscal policy were to emerge by the end of the year.
External sector risks remain manageable
We see Ukraine’s C/A deficit widening only marginally from last year’s USD 2.1 bln, estimated at 1.9% of 2018F GDP. Although the growth in commodity imports is slightly outpacing exports (+8.6% yoy vs. +11.9% in 1Q, respectively) and the trade in goods deficit is set to widen to c. 9% of GDP, the services trade surplus and remittances will offset most of the gap.
FDI is set to be at c. 1% of GDP this year on the back of pre-election uncertainty and as privatization efforts have stalled. With a growing C/A gap and no FDI, the strength of Ukraine’s external position and the stability of the FX market are entirely dependent on the country’s ability to secure net inflows of debt capital to the state and private sector. Needless to say, this will become increasingly difficult if Ukraine is unable to resume cooperation with the IMF. If there were to be no further inflows, scheduled redemptions of previous IMF loans and other external public debt would cut the NBU’s reserves from the current USD 18.4 bln to below USD 15.0 bln before the election in March 2019.
Key macro data and projections
| 2009 | 2010 | 2011 | 2012 | 2013 | 2014 | 2015 | 2016 | 2017 | 2018E | |
| Business cycle indicators | ||||||||||
| Real GDP, chg yoy | -14.8% | 4.1% | 5.2% | 0.2% | 0.0% | -6.6% | -9.8% | 2.3% | 2,5% | 3,1% |
| Household consumption, chg yoy | -14.9% | 7.1% | 15.7% | 8.4% | 6.9% | -8.3% | -20.7% | 1.8% | 7,8% | 6,1% |
| Investments in fixed capital, chg yoy | -50.5% | 3.9% | 7.1% | 5.0% | -6.7% | -24.0% | -9.2% | 20.1% | 18,2% | 12,0% |
| Industrial output, chg yoy | -21.9% | 11.2% | 8.0% | -0.7% | -4.3% | -10.1% | -13.0% | 2.8% | 0,4% | 3,5% |
| Nominal GDP, UAH bln | 913 | 1,079 | 1,300 | 1,405 | 1,465 | 1,587 | 1,989 | 2,383 | 2 983 | 3 506 |
| Nominal GDP, USD bln | 117 | 136 | 163 | 176 | 183 | 134 | 91 | 93 | 112 | 131 |
| GDP per capita, USD | 2,550 | 2,972 | 3,580 | 3,865 | 4,030 | 3,117 | 2,134 | 2,193 | 2 638 | 3 077 |
| CPI (eop) | 12.3% | 9.1% | 4.6% | -0.2% | 0.5% | 24.9% | 43.3% | 12.4% | 13,7% | 8,9% |
| CPI average | 15.9% | 9.4% | 8.0% | 0.6% | -0.3% | 12.1% | 48.7% | 13.9% | 14,4% | 11,9% |
| Unemployment (ILO methodology, avg) | 9.6% | 8.9% | 8.7% | 8.2% | 7.8% | 9.7% | 9.5% | 9.7% | 9,5% | 8,8% |
| Balance of payments | ||||||||||
| Current account balance, USD bln | -1.7 | -3.0 | -10.2 | -14.3 | -16.5 | -4.6 | -0.2 | -3.5 | -2,1 | -2,8 |
| % GDP | -1.5% | -2.2% | -6.3% | -8.1% | -9.0% | -3.4% | -0.2% | -3.7% | -1,9% | -2,1% |
| Financial account balance, USD bln | -12.0 | 8.0 | 7.8 | 10.1 | 18.6 | -9.1 | 0.6 | 4.7 | 4,7 | 2,0 |
| % GDP | -10.2% | 5.9% | 4.8% | 5.8% | 10.1% | -6.8% | 0.6% | 5.0% | 4,2% | 1,5% |
| FDI net, USD bln | 4.7 | 5.8 | 7.0 | 7.2 | 4.1 | 0.3 | 3.0 | 3.3 | 1,2 | 2,0 |
| % of GDP | 4.0% | 4.2% | 4.3% | 4.1% | 2.2% | 0.2% | 3.3% | 3.5% | 1,1% | 1,5% |
| Gross NBU reserves (eop), USD bln | 26.5 | 34.6 | 31.8 | 24.5 | 20.4 | 7.5 | 13.3 | 15.5 | 18,8 | 19,0 |
| Monetary and banking indicators | ||||||||||
| Monetary base, UAH bln | 195 | 226 | 240 | 255 | 307 | 333 | 336 | 382 | 399 | 423 |
| Monetary base, chg. yoy | 4% | 16% | 6% | 6% | 20% | 8% | 1% | 14% | 4% | 6% |
| Money supply (M3), UAH bln | 487 | 598 | 683 | 773 | 909 | 957 | 994 | 1,103 | 1 209 | 1 293 |
| Money supply, chg. yoy | -5% | 23% | 14% | 13% | 18% | 5% | 4% | 11% | 5% | 7% |
| Monetary multiplier (eop M3/MB) | 2.5 | 2.6 | 2.8 | 3.0 | 3.0 | 2.9 | 3.0 | 2.9 | 3,0 | 3,1 |
| Bank loans, chg. yoy | -2% | 1% | 10% | 2% | 12% | 12% | -4% | 2% | 2% | 8% |
| Bank deposits, chg. yoy | -8% | 26% | 18% | 16% | 17% | 5% | 4% | 11% | 13% | 15% |
| Loan-to-deposit ratio | 219% | 175% | 162% | 142% | 136% | 151% | 137% | 126% | 113% | 106% |
| Exchange rate | ||||||||||
| Official UAH/USD (eop) | 7.99 | 7.96 | 7.99 | 7.99 | 7.99 | 15.77 | 24.00 | 27.19 | 28.07 | 28.50 |
| Official UAH/USD (avg) | 7.79 | 7.94 | 7.97 | 7.99 | 7.99 | 11.89 | 21.84 | 25.55 | 26.60 | 27.70 |
| Budget and debt indicators | ||||||||||
| State budget revenues, UAH bln | 209.7 | 240.6 | 314.6 | 346.0 | 339.2 | 357.1 | 534.6 | 616.3 | 793,4 | 905,2 |
| % of GDP | 23.0% | 22.3% | 24.2% | 24.6% | 23.2% | 22.5% | 26.9% | 25.9% | 26,6% | 25,8% |
| State budget expenditures, UAH bln | 245.2 | 304.9 | 338.1 | 399.4 | 403.9 | 435.1 | 579.8 | 686.4 | 841,3 | 1 001 |
| % of GDP | 26.8% | 28.3% | 26.0% | 28.4% | 27.6% | 27.4% | 29.2% | 28.8% | 28,2% | 28,6% |
| State budget balance, UAH bln | -35.5 | -64.3 | -23.6 | -53.4 | -64.7 | -78.0 | -45.2 | -70.1 | -47,9 | -96,0 |
| % of GDP | -3.9% | -6.0% | -1.8% | -3.8% | -4.4% | -4.9% | -2.3% | -2.9% | -1,6% | -2,7% |
| Public debt, UAH bln | 318 | 432 | 473 | 516 | 584 | 1,101 | 1,572 | 1,930 | 2 142 | 2 285 |
| % GDP | 34.8% | 40.1% | 36.4% | 36.7% | 39.9% | 69.4% | 79.0% | 81.0% | 71,8% | 65,2% |
Odds for IMF program are improving
Ukrainian leaders have long been weighing the costs and benefits of resuming the IMF loan program. Political appetite for reforms has faded considerably as the 2019 election year looms. However, the need to minimize economic risks and ensure currency stability – a critical measure of economic policy success in the eyes of the electorate – into 2019 is forcing the authorities to move on with program commitments. Recent developments suggest a law on an anti-corruption court that is broadly in-line with the IMF’s requirements may become a reality within the next few weeks. The question of gas tariff revisions remains unresolved, but a decision should follow the passage of the anti-corruption court law. In this case, a swift IMF program revision and a disbursal of a new loan tranche is almost a certainty.