Global IPO activity hit as volatility spikes and China pauses
- Record-breaking run in Mainland China ends as listings are suspended
- Developed markets set to pick up the pace but unlikely to make up the global shortfall on 2014 levels
- Financial sponsors “wait and see” as volatility increases
There was a marked change in global IPO activity and investor sentiment during the third quarter of this year. After a stellar second quarter, particularly in China, which had its busiest quarter on record, IPO activity in emerging markets slowed, triggered by the sharp market correction and suspension of new listings in China. In developed markets, IPOs remained depressed on the back of significant market volatility, although indications are that activity will pick up in the final quarter of the year, according to the quarterly EY Global IPO Trends: 2015 3Q.
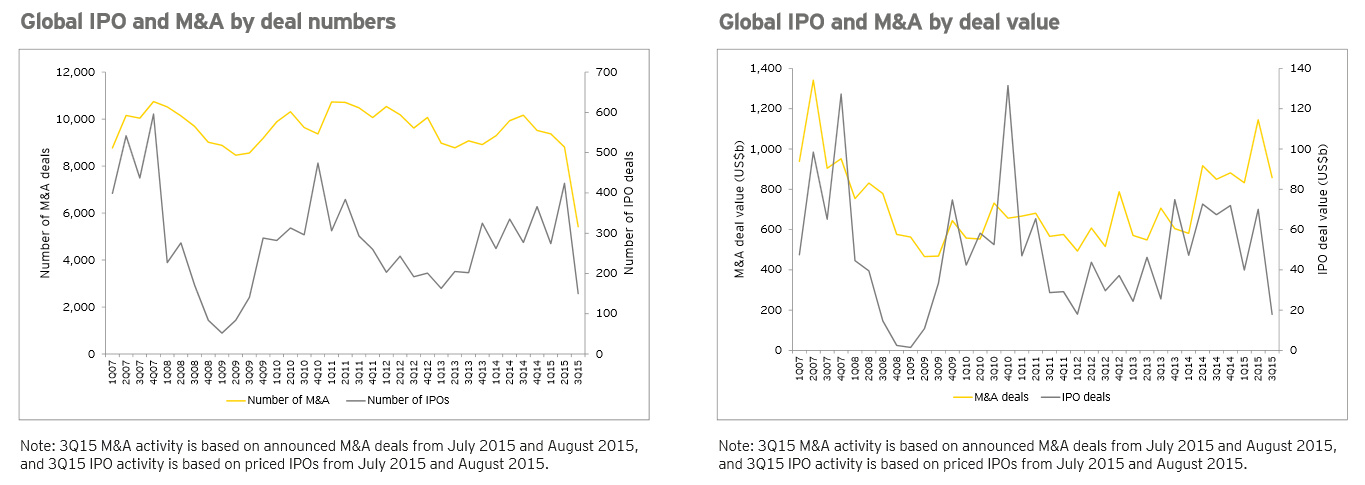
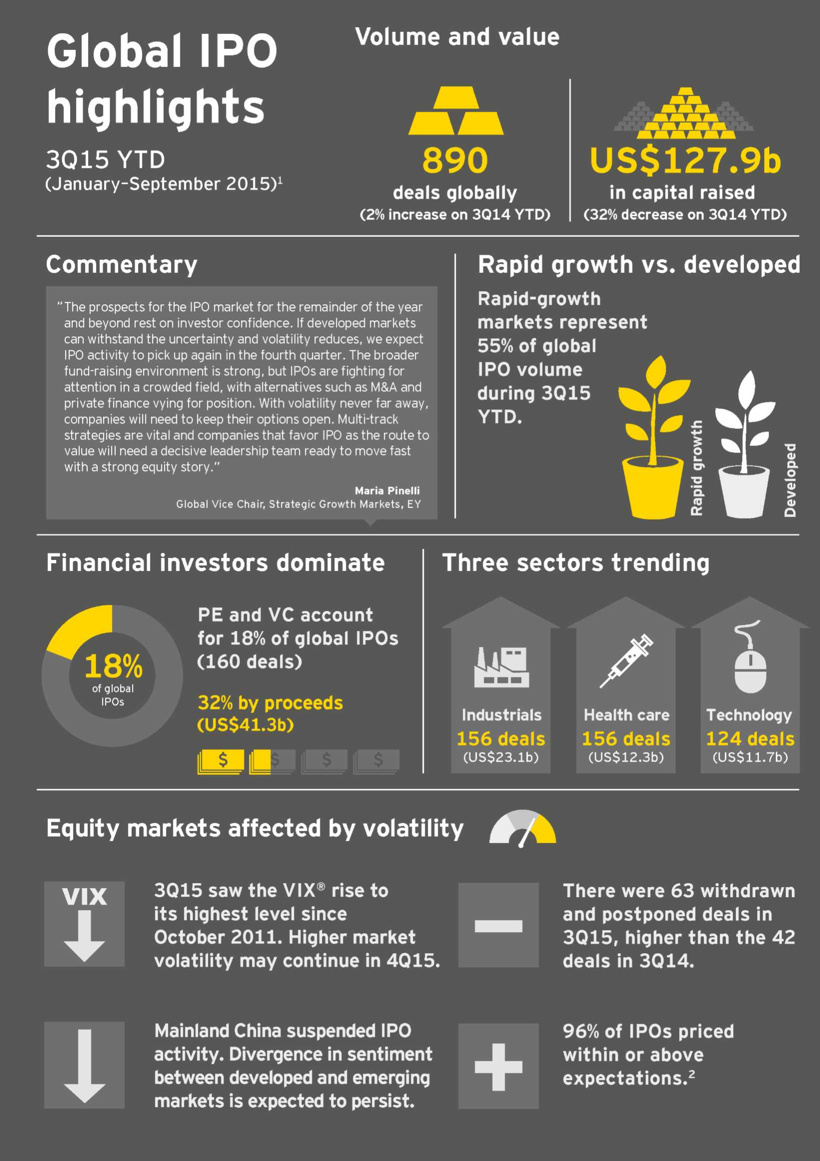
The total number of global IPOs (192) and the proceeds raised (US$ 17.9b) in 3Q15 were down on the previous quarter by 55% and 75%, respectively. While the first nine months of 2015 had marginally more listings than the first nine months of 2014 (up 2%), global IPO proceeds are now down 32% on the same period last year. This is due, in part, to the absence of Chinese IPO deal flow and the on-going shift toward smaller average deal sizes. Even excluding the Alibaba IPO, global proceeds in 3Q15 were 58% lower than 3Q14.
Financial sponsors adopt a wait and see approach on IPOs
With volatility in August reaching levels not seen since October 2011 and the market correction in China, financial sponsor appetite for IPO exits was supressed in 3Q15. As sponsors adopted a wait and see approach to realizing exits, deal value for PE- and VC-backed IPO exits (26 IPOs raising US$4.9b) fell 89% compared to 3Q14 and deal numbers were down 62%, with Europe and the UK in particular, falling sharply. 2015 so far has been lackluster in terms of financial sponsor participation, with private equity (PE) and venture capital (VC) players accounting for only 18% of deals globally, compared to 30% at the same time last year.
Maria Pinelli, EY’s Global Vice Chair, Strategic Growth Markets, says:
“The prospects for the IPO market for the remainder of the year and beyond rest on investor confidence. Good news seems to be mixed with bad, which has led to this stop-start market. Volatility has impacted different markets at different times of the year, from worries surrounding Greece and stock market turbulence in Asia, to recent uncertainty over US interest rates. If developed markets can withstand the uncertainty and volatility reduces, we’d expect IPO activity to pick up again in the last quarter, with our teams on the ground reporting very healthy levels of activity in the pipeline.”
Asia-Pacific on top for now
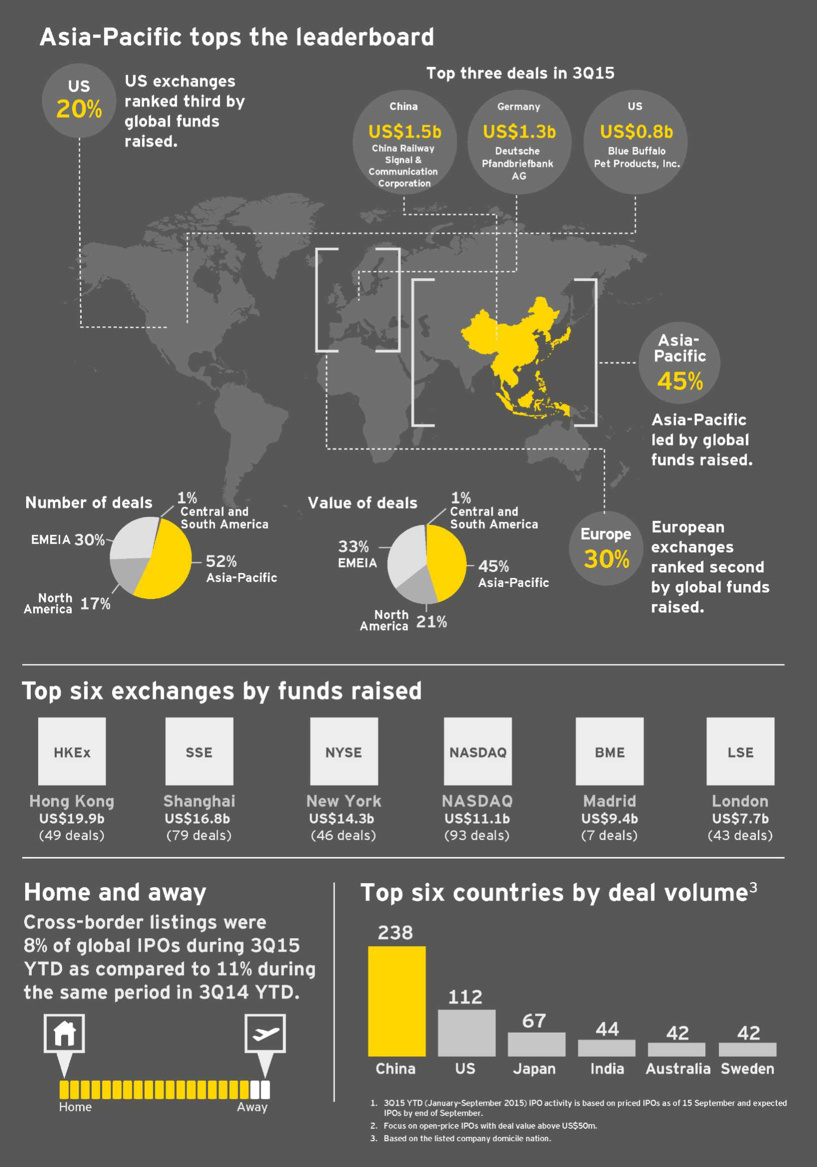
With 466 IPOs raising US$57.8b through the first nine months of the year, Asia-Pacific continues to be the leading region, both in terms of deal number and proceeds. However, IPO activity saw a sharp contraction in 3Q15 with 101 IPOs raising US$8.4b, compared to 218 IPOs raising US$34.9b in the second quarter of 2015. Compared to the same period in 2014, this is a 25% drop in deal number and 43% drop in proceeds. Japan is on course for 100 IPOs by the end of 2015, which would be the best year since 2007.
Pinelli says: “The IPO market in Asia-Pacific is entering a period of uncertainty. With further IPOs unlikely on Chinese exchanges this year, overall deal volume in the fourth quarter will be down. However, while investors in ASEAN markets are pulling back, companies are continuing to list in the more mature markets. Japan is on course for a record year and activity looks set to pick up again in Australia in the fourth quarter. Although Mainland China has already seen more stock exchange listings in 2015 than in the whole of 2014, the outlook for the region to the end of the year is mixed.”
US IPOs show signs of recovery
Despite a challenging year for IPOs, which has seen US activity levels down 37% by deal numbers and 67% by capital raised compared to the first nine months of 2014, the US was the top performing country in 3Q15 with 32 deals raising US$4.9b. However, the US still lagged behind Asia-Pacific in terms of both the number of deals and capital raised. The US hosted only two of the world’s ten largest IPOs in 3Q15 – Blue Buffalo Pet Products, Inc. raising US$778m and Terraform Global Inc. raising US$675m – a reflection of the global trend toward smaller deal sizes.
Although deal sizes may be smaller, the performance statistics for US IPOs are positive. Sixty-seven percent of IPOs in the US this year have priced within or above initial filing range. With average first-day returns of 21.1%, in 3Q15, newly listed companies are outperforming the broader market, with health care leading the way. As the economic recovery gathers pace and the pipeline builds, a stronger 4Q15 is likely.
There has been a clear shift in the sectors coming to market in the US. In 2014, technology raised more than twice the proceeds of any other sector in the first nine months and was the second busiest in terms of deal numbers over that period. In the first nine months of 2015 so far its share of capital raised is 14%, down from 45% in the same period of 2014, and share of deal volume is 12%, down from 18%. Health care, and in particular biotech, has moved center stage, accounting for 45% of deals so far in 2015.
Pinelli says: “The shine has come off technology IPOs in 2015 and we believe two drivers are at work. The first is that the private funding market has become more highly capitalized and has seized on tech as its investment of choice, reducing the pool of companies available to list. The second driver is that biotech assets are coming of age and the equity story is highly appealing to wholesale and retail investors.”
EMEIA performance muted but prospects strong for 4Q15
IPO activity in EMEIA in the third quarter was muted, with steadily improving economic fundamentals offset by increased volatility and the fallout from global stock market fluctuations. A total of 54 deals raised US$3.8b in 3Q15, down 56% and 80% respectively from 2Q15, placing EMEIA exchanges third by proceeds after Asia-Pacific and the Americas, and second by deal number after Asia-Pacific. For the nine months up to September, EMEIA exchanges saw 266 IPOs, raising US$41.8b, down 9% by deal number and 29% by capital raised respectively on the same time period in 2014.
Pinelli, says: “Volatility has led to caution among investors, business leaders and financial sponsors, which has led to a prevalence of multi-tracking in the market, with M&A or trade sales often offering a more attractive risk return ratio than IPOs. However, with European markets supported by low interest rates and the ECB’s quantitative easing program, confidence is rising, evidenced by the low gold price and stock market valuations up 10% year-to-date. With the Eurozone economy staging a slow-but-steady economic recovery, IPO prospects for 4Q15 are positive.”
Prospects for Q415 and 2016 improving
Pinelli concludes: “This continues to be a stop-start year for global IPOs as broader economic developments and volatility impact stock market performance and investor confidence. Quarterly IPO activity has fluctuated, with each region having good and bad quarters. With the ongoing closure of Mainland Chinese exchanges to new listings, and capital raised down about a third on 2014 at the nine-month point, it seems unlikely that 2015 will match 2014 performance.
“The broader fundraising environment is strong, but IPOs are fighting for attention in a crowded field, with alternatives such as M&A and private finance vying for position. With volatility never far away, companies will need to keep their options open. Multi-track strategies are vital and companies that favor IPO as the route to value will need a decisive leadership team ready to move fast with a strong equity story.”
January 2015–September 2015 global IPOs by sector
|
Sector |
Number of deals |
% of global deal number |
Proceeds (US$) |
% of global capital raised |
|
|
Health care |
156 |
17.5% |
$12,311.1 |
9.6% |
|
|
Industrials |
156 |
17.5% |
$23,116.3 |
18.1% |
|
|
Technology |
124 |
13.9% |
$11,716.5 |
9.2% |
|
|
Consumer products and services |
80 |
9.0% |
$11,712.3 |
9.2% |
|
|
Materials |
79 |
8.9% |
$6,798.7 |
5.3% |
|
|
Financials |
58 |
6.5% |
$23,647.5 |
18.5% |
|
|
Consumer staples |
51 |
5.7% |
$4,962.2 |
3.9% |
|
|
Energy |
51 |
5.7% |
$11,505.9 |
9.0% |
|
|
Retail |
43 |
4.8% |
$5,763.3 |
4.5% |
|
|
Real estate |
41 |
4.6% |
$4,387.4 |
3.4% |
|
|
Media and entertainment |
38 |
4.3% |
$3,124.0 |
2.4% |
|
|
Telecommunications |
13 |
1.5% |
$8,824.4 |
6.9% |
|
|
Global total |
890 |
100.0% |
$127,869.6 |
100.0% |
|
Full Report - EY Global IPO Trends 2015 3Q (англ)