As Ukraine enters the 2019 election cycle with no clear outcome, businesses and foreign investors are adopting a wait-and-see approach. GDP growth is slowing due to weakening demand and tight monetary and fiscal policies, but broad macroeconomic and financial stability remain and we see no material risks to that base case. Inflation is sure to slow further in 2019 and the NBU is almost certain to start easing monetary policy in the coming months. Risks related to the external sector are also manageable – the C/A widened in 2018 but is unlikely to widen further in 2019. Debt will be available for both the private and public sectors, as long as the IMF program continues as planned.
Economic growth is set to slow in 2019
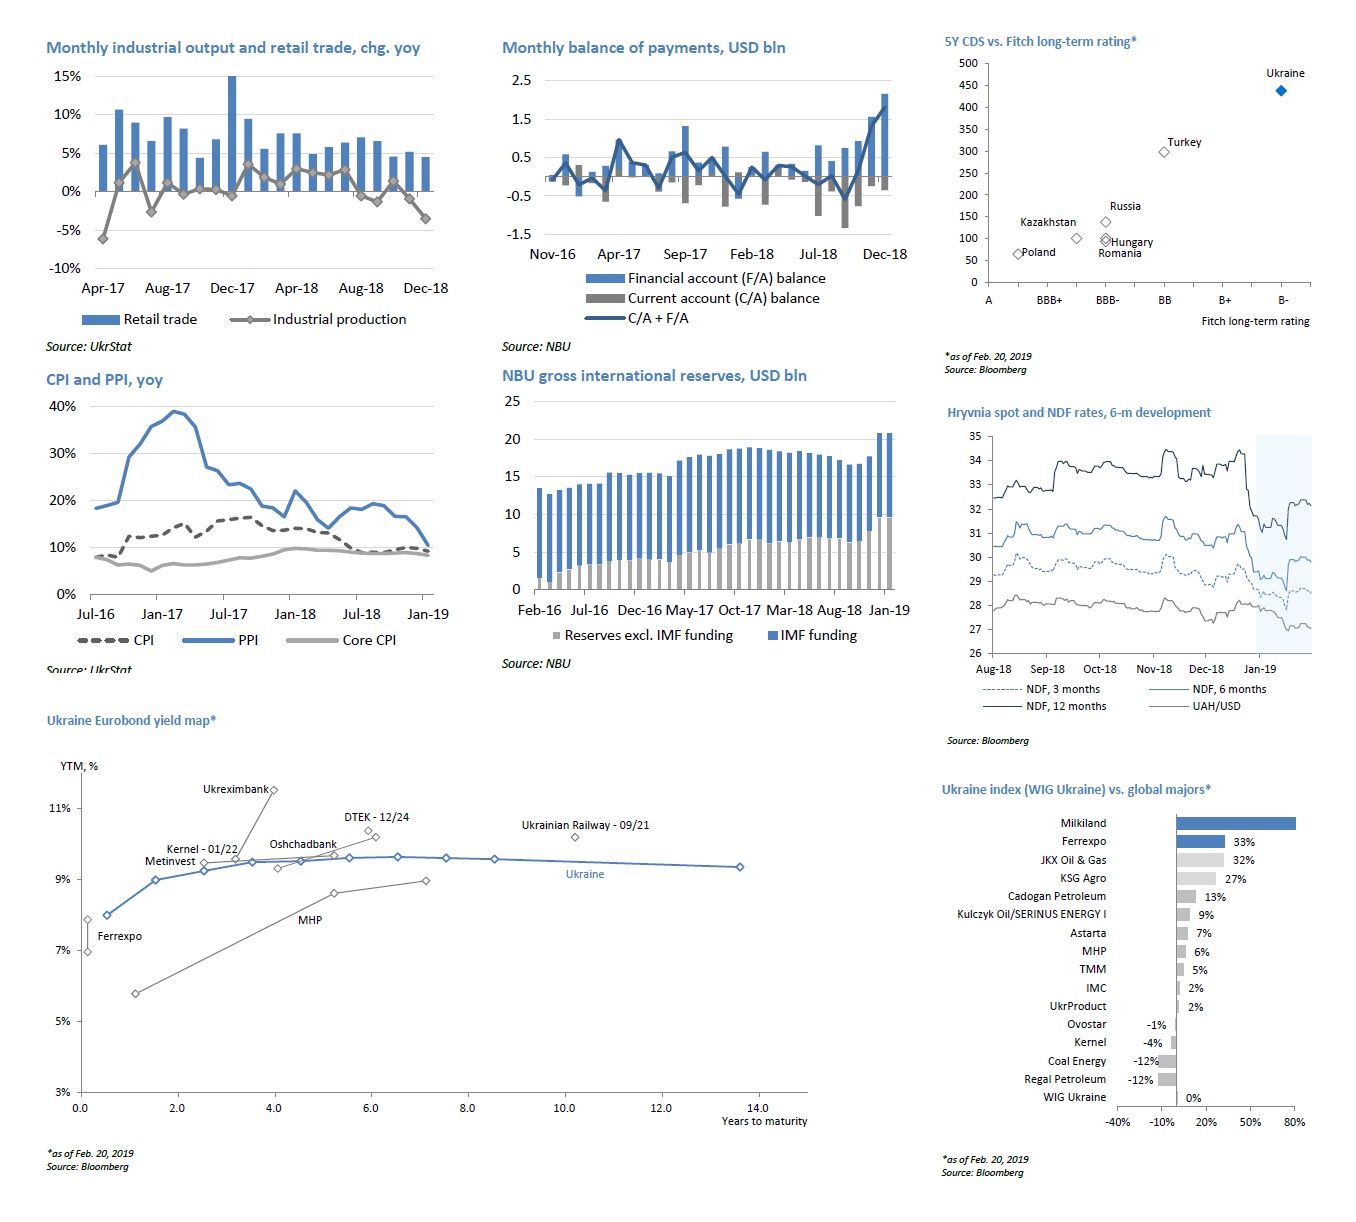
Q418 GDP growth came in at 3.4% yoy, which will put 2018 FY growth at around 3.3% by our estimates. The Q4 pickup was driven by the bumper harvest: 70 million tons of grain, +13% yoy, and Ukraine’s largest harvest on record. However, the topline growth number is far from rosy everywhere – growth in some key sectors slowed materially at the end of the year. Industrial production remains stagnant (+1.1% yoy for FY 2018) and down 3.5% yoy in December. Cargo transportation performed similarly. Retail trade remained the key growth contributor throughout 2018: full-year growth stood at 5.6% yoy, with a relatively steady pace throughout all months.
The prevailing view domestically – and one that we share – is that economic growth will decelerate in 2019 for several important reasons – softer private household demand because of weaker income growth, election-related uncertainty, and continued tight monetary policy as the NBU remains committed to bringing inflation down to its target. On top of that, fiscal policy is set to remain tight as external debt market conditions are not currently supportive for borrowing, which makes fiscal impulse largely impossible. External markets are also unlikely to provide much support for the domestic economy. With that in mind, we project 2019 GDP growth at 2.7% yoy. That means Ukraine will not pay out on the VRI in 2021 based on the results of 2019 as real GDP growth below 3.0% in any reference period results in zero payment.
Inflation in check, will decelerate significantly in 2019
CPI closed out 2019 at 9.8% and slowed further to 9.2% in January. The slowdown was helped by a stronger hryvnia and cheaper fuel prices. Even though the end-2019 inflation rate was above the NBU’s target range of 6% +/-2% for 2018, the single-digit territory suggests the deceleration is now firmly anchored. Price pressures in 2019 will continue to stem from two major sources – high growth in salaries (even though we expect that to slow materially) and a further increase in regulated utility tariffs for natural gas and heating in-line with IMF requirements. All in, all the preconditions are in place for inflation to slip closer to 7.0% by the end of 2019. This is still above the NBU’s target range of 5% +/-1pp (the set target from 2019 onwards), but the central bank has signaled it will allow inflation to meet the target range in 2020 and it will not accelerate that trend at all costs. We therefore expect the NBU to start easing monetary policy in the coming months, but the process will be very slow.
C/A deficit widens in 2019, still in safe territory
The current account deficit widened materially last year – estimated at 3.6% of GDP vs. 2.2% in 2017, mainly driven by a larger trade deficit in goods. As in the previous year, imports continued to outpace exports but encouragingly, over 1/3 of the total increase was driven by machinery purchases. The larger trade deficit in goods was largely offset with growth in remittances, which surged 24% in 2018 to around 8.8% of GDP. We do not expect the C/A deficit to widen further as the deceleration in household income growth will dampen the growth of commodity imports. We expect the C/A deficit to stay in the range of 3.0%-4.0% in the medium term.
FDI is sure to remain subdued through 2019 as foreign investors maintain a cautious stance through the election cycle. As a result, FDI is likely to cover only half the C/A gap in 2019. Debt capital will remain available for the private corporate sector (including intra-group loans from related parties) and some large companies are likely to secure some large loans. The public sector will secure official funding from the IMF and other IFIs to refinance maturing debt and cover the fiscal gap. Our baseline scenario assumes the current Stand-by program with the IMF will continue smoothly; any deviation would force us to revise our key macroeconomic forecast. We also expect NBU reserves to stay broadly flat through 2019.
Macroeconomic indicators Ukraine 2018-2019
|
|
2010 |
2011 |
2012 |
2013 |
2014 |
2015 |
2016 |
2017 |
2018E |
2019E |
|
Business cycle indicators |
||||||||||
|
Real GDP, chg yoy |
4.1% |
5.2% |
0.2% |
0.0% |
-6.6% |
-9.8% |
2,3% |
2.5% |
3.3% |
2.7% |
|
Household consumption, chg yoy |
7.1% |
15.7% |
8.4% |
6.9% |
-8.3% |
-20.7% |
1,8% |
7.8% |
6.1% |
4.9% |
|
Investments in fixed capital, chg yoy |
3.9% |
7.1% |
5.0% |
-6.7% |
-24.0% |
-9.2% |
20,1% |
18.2% |
12.0% |
7.0% |
|
Industrial output, chg yoy |
11.2% |
8.0% |
-0.7% |
-4.3% |
-10.1% |
-13.0% |
2,8% |
0.4% |
1.1% |
2.5% |
|
Nominal GDP, UAH bln |
1,079 |
1,300 |
1,405 |
1,465 |
1,587 |
1,989 |
2 383 |
2 983 |
3 513 |
3 968 |
|
Nominal GDP, USD bln |
136 |
163 |
176 |
183 |
134 |
91 |
93 |
112 |
129 |
140 |
|
GDP per capita, USD |
2,972 |
3,580 |
3,865 |
4,030 |
3,117 |
2,134 |
2 193 |
2 638 |
3 037 |
3 293 |
|
CPI (eop) |
9.1% |
4.6% |
-0.2% |
0.5% |
24.9% |
43.3% |
12,4% |
13.7% |
9.8% |
7.1% |
|
CPI average |
9.4% |
8.0% |
0.6% |
-0.3% |
12.1% |
48.7% |
13,9% |
14.4% |
10.9% |
8.2% |
|
Unemployment (ILO methodology, avg) |
8.9% |
8.7% |
8.2% |
7.8% |
9.7% |
9.5% |
9,7% |
9.5% |
8.5% |
8.0% |
|
Balance of payments |
||||||||||
|
Current account balance, USD bln |
-3.0 |
-10.2 |
-14.3 |
-16.5 |
-4.6 |
-0.2 |
-1,3 |
-2.4 |
-4.7 |
-4.7 |
|
% GDP |
-2.2% |
-6.3% |
-8.1% |
-9.0% |
-3.4% |
-0.2% |
-1,4% |
-2.2% |
-3.6% |
-3.4% |
|
Financial account balance, USD bln |
8.0 |
7.8 |
10.1 |
18.6 |
-9.1 |
0.6 |
2,5 |
5.0 |
7.5 |
4.0 |
|
% GDP |
5.9% |
4.8% |
5.8% |
10.1% |
-6.8% |
0.6% |
2,7% |
4.5% |
5.8% |
2.9% |
|
FDI net, USD bln |
5.8 |
7.0 |
7.2 |
4.1 |
0.3 |
3.0 |
3,3 |
2.6 |
2.4 |
2.5 |
|
% of GDP |
4.2% |
4.3% |
4.1% |
2.2% |
0.2% |
3.3% |
3,5% |
2.3% |
1.8% |
1.8% |
|
Gross NBU reserves (eop), USD bln |
34.6 |
31.8 |
24.5 |
20.4 |
7.5 |
13.3 |
15,5 |
18.8 |
20.8 |
20.5 |
|
Monetary and banking indicators |
||||||||||
|
Monetary base, UAH bln |
226 |
240 |
255 |
307 |
333 |
336 |
382 |
399 |
436 |
466 |
|
Monetary base, chg. yoy |
16% |
6% |
6% |
20% |
8% |
1% |
14% |
5% |
9% |
7% |
|
Money supply (M3), UAH bln |
598 |
683 |
773 |
909 |
957 |
994 |
1,103 |
1 209 |
1 278 |
1 367 |
|
Money supply, chg. yoy |
23% |
14% |
13% |
18% |
5% |
4% |
11% |
10% |
6% |
7% |
|
Bank loans, chg. yoy |
1% |
10% |
2% |
12% |
12% |
-4% |
2% |
2% |
6% |
10% |
|
Bank deposits, chg. yoy |
26% |
18% |
16% |
17% |
5% |
4% |
11% |
13% |
4% |
8% |
|
Loan-to-deposit ratio |
175% |
162% |
142% |
136% |
151% |
137% |
126% |
113% |
115% |
117% |
|
Exchange rate |
||||||||||
|
Official UAH/USD (eop) |
7.96 |
7.99 |
7.99 |
7.99 |
15.77 |
24.00 |
27.19 |
28,07 |
27,69 |
29,00 |
|
Official UAH/USD (avg) |
7.94 |
7.97 |
7.99 |
7.99 |
11.89 |
21.84 |
25.55 |
26,60 |
27,20 |
28,34 |
|
Budget and debt indicators |
||||||||||
|
State budget revenues, UAH bln |
240.6 |
314.6 |
346.0 |
339.2 |
357.1 |
534.6 |
616.3 |
793.4 |
928.1 |
1 039 |
|
% of GDP |
22.3% |
24.2% |
24.6% |
23.2% |
22.5% |
26.9% |
25.9% |
26.6% |
26.4% |
26.2% |
|
State budget expenditures, UAH bln |
304.9 |
338.1 |
399.4 |
403.9 |
435.1 |
579.8 |
686.4 |
841.3 |
987.4 |
1 107 |
|
% of GDP |
28.3% |
26.0% |
28.4% |
27.6% |
27.4% |
29.2% |
28.8% |
28.2% |
28.1% |
27.9% |
|
State budget balance, UAH bln |
-64.3 |
-23.6 |
-53.4 |
-64.7 |
-78.0 |
-45.2 |
-70.1 |
-47.9 |
-59.3 |
-67.5 |
|
% of GDP |
-6.0% |
-1.8% |
-3.8% |
-4.4% |
-4.9% |
-2.3% |
-2.9% |
-1.6% |
-1.7% |
-1.7% |
|
Public debt, UAH bln |
432 |
473 |
516 |
584 |
1,101 |
1,572 |
1,930 |
2 142 |
2 169 |
2 410 |
|
% GDP |
40.1% |
36.4% |
36.7% |
39.9% |
69.4% |
79.0% |
81.0% |
71.8% |
61.7% |
60.7% |